|
Area List Pro Interfaces This document illustrates some of the interfaces that can be created with the "grandaddy" of 4D plug-ins, Area List Pro. In the years and years that I’ve been working with this product, I’ve been fortunate to be able to create some very popular interfaces and have found AreaList Pro to be as stable as it is flexible. A project that was written for sales reps for US WEST Direct used AreaList Pro project for data entry. Additional information about “Spenser” is available here. AreaList Pro was the key product in building an interface for the General Ledger for a major 4D-based vertical market program. |
| Server EKG |
|
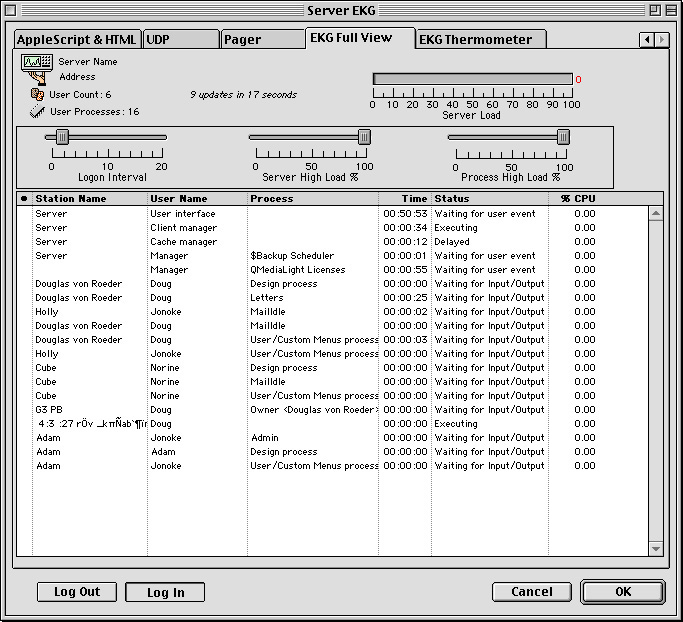
Server EKG is a 4D-based programs that monitor the status of a 4D Server. The interface shown below is from the multi-server version which relies on multiple process capability in addition to AreaList Pro. (The Station Name for Server EKG is in “stealth” mode.) |
| Gantt Chart Interface |
|
The Gantt chart interface was a key part of a project management application written for the R&D division of US WEST. The key to creating this interface was to treat the screen as a matrix consisting of cells of 5 characters each. Each event was loaded into a 60-character string array and then transposed in 5 character sections into the appropriate array. The event represented in the first row had a start date in the range of May 1 to May 6 and an end date between June 1 and June 6. The start date symbol was placed in element 21 and the end date element in 26. Elements 21 through 25 were placed into array 5, the array representing May, and elements 26 through 31 were placed in the 6th array, the array representing the month of June. |
| Timecard and Task Assignment |
|
These two interfaces were developed for the consulting division of US WEST. The performance demands for the timesheet were such that data could not be stored using the traditional approach of related records. Instead, the code used PictBundle to store the arrays in a picture field in eachTimesheet record. This reduced the overhead sufficiently to provide excellent response time. When the used clicked the “Commit” checkbox, the code parsed the arrays for entries that contained non-zero values and created records using Selection to array. |
|
The Tasks and Assignments screen shown below was used to assign personnel to tasks. CalendarSet provided the popups for Start Date and End Date for Tasks. The user would drag and drop a Task entry to the Assignment area located inthe lower half of the screen. Personnel were assigned by dragging and dropping from Staff Member entries from the Area List to the Assignment. In the screenshot below, the task “Make staffing request” has two staff members assigned. While creating assignments, the user could view level of effort graphs for a staff member by double clicking on the Staff Member entry. The graph illustrated the work load for the individual over the duration of the Project. |
| FASTIE |
|
These two screens formed the core of a database that ran a fantasy football league. The New Team screen was used by a customer service representative to enter the players that comprised the customer’s team. When the user entered a player number or a player name, the Area List Pro callback opened a Display List of potential matches. One item of interest in this interface is cell enterability and formatting — the bold, numbered cells are non-enterable while the cells formatted in plain style are enterable. |
|
After a team had been created, customer trades were entered in the screen shown below. Players could be activated, moved to the starting roster, moved to the reserves, etc. through this highly interactive screen. |